Matt Cycle
Well-Known Member
- Relationship to Diabetes
- Type 1
The mudguards were taken off again and it was out this afternoon for a 100+km ride to Tatton Park and back via Goostrey. Lovely weather - not too hot with plenty of sun, occasional cloud and dry (rain forecast for tomorrow). One or two bg issues on this ride (see below) 🙄.
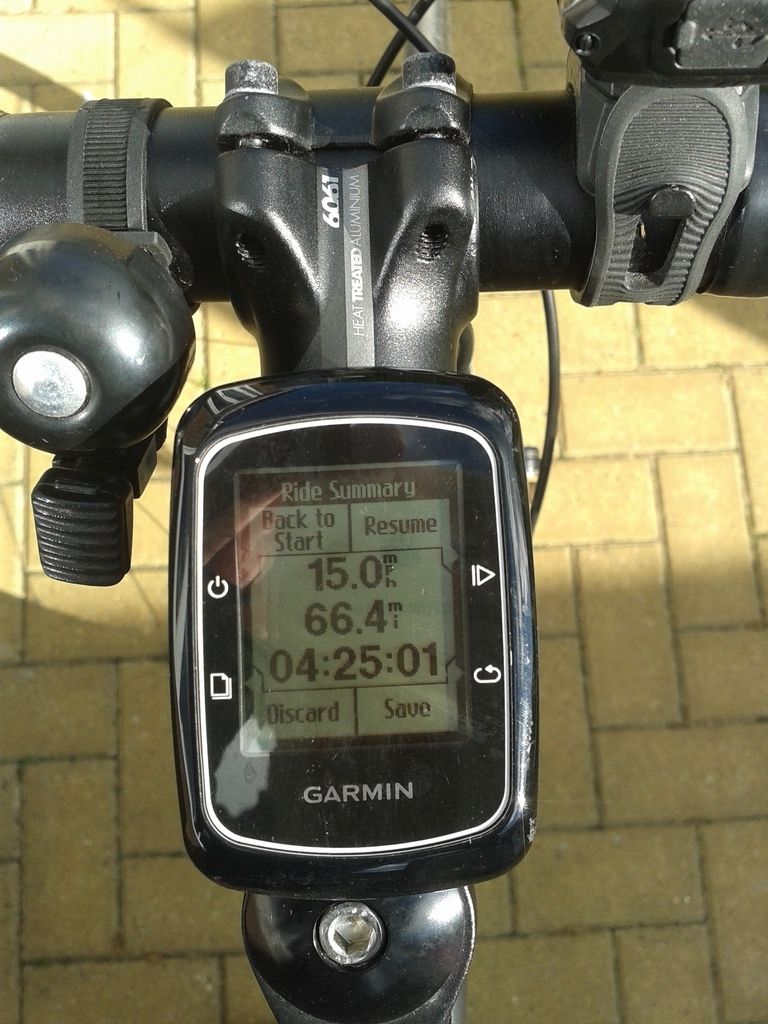
Strava stats are 66.4 miles completed at an average speed of 15.0mph and elevation gain of 2600 feet.
The Libre finished yesterday so it was back to bg readings. Compared to what's happened over the last 2 weeks this just proves that T1 diabetes sometimes just isn't really fair. I'd had high readings on those previous rides so didn't drop my Tresiba as much and then this happens 🙄. Lots of testing on the ride and it was a good job I did. At the start 7.6 mmol/l, at 11 miles 5.4 mmol/l, at 21 miles 3.3 mmol/l, at 30 miles 6.4 mmol/l, at 38 miles 3.3 mmol/l, at 44 miles 4.6 mmol/l, at 50 miles 5.2 mmol/l, at 56 miles 4.8 mmol/l, at 62 miles 4.2 mmol/l and back home 4.6 mmol/l. I was struggling to eat stuff to just try and stop dropping into hypo territory. I had...wait for it....6 gels, malt loaf, glucogel and 1.5 energy/protein bars.
These rollercoaster levels are a bit of a pain but it doesn't put me off because we're T1, powered by insulin and can do anything if we want to. 🙂
Lake at Tatton Park

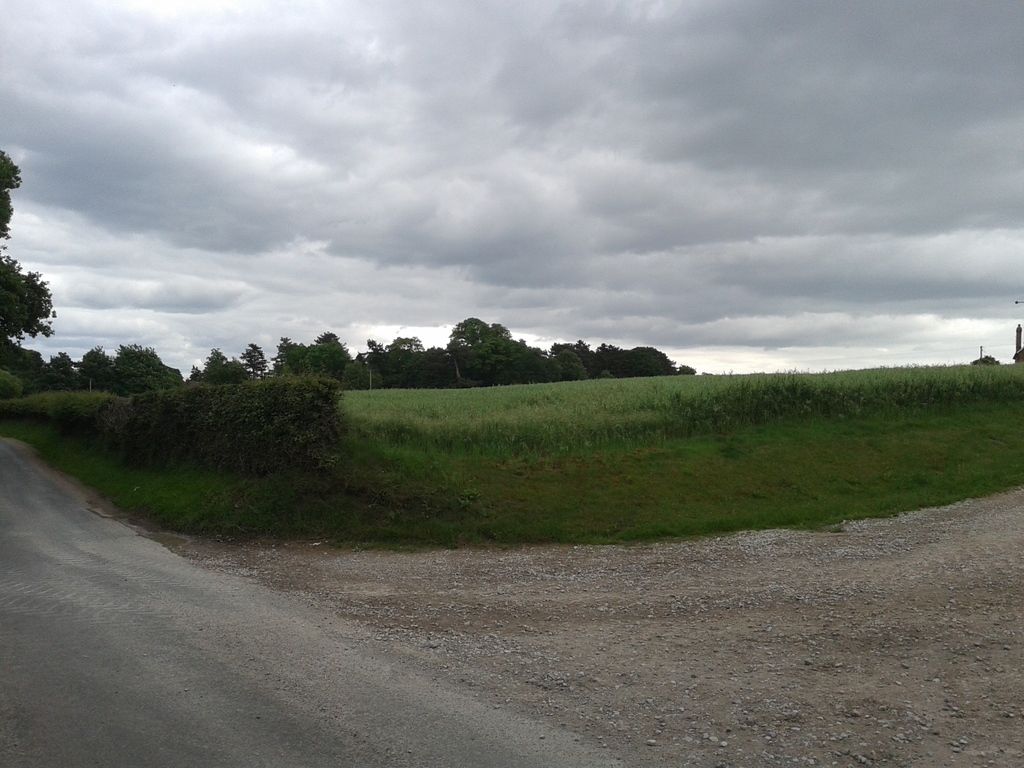
Maize just peeping through the ground in this field at Jodrell Bank

Wheat field almost fully grown also near Jodrell Bank - just needs some sun on it.

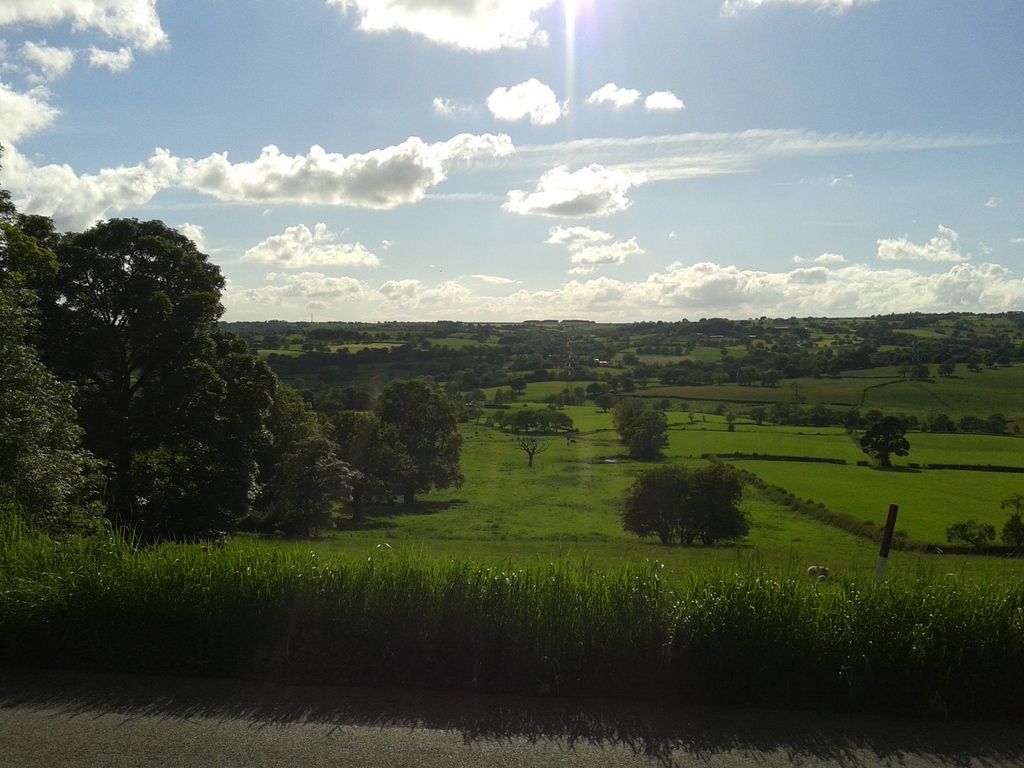
The women's Tour of Britain will be travelling up this road on Thursday near Rudyard. Not sure they'll have much time to admire the views. I'm off work that day to see it (oh and to have my retinopathy check as well)

The Garmin (same as Strava this time). The bottom number is the ride time i.e. 4hrs 25mins.

Strava stats are 66.4 miles completed at an average speed of 15.0mph and elevation gain of 2600 feet.
The Libre finished yesterday so it was back to bg readings. Compared to what's happened over the last 2 weeks this just proves that T1 diabetes sometimes just isn't really fair. I'd had high readings on those previous rides so didn't drop my Tresiba as much and then this happens 🙄. Lots of testing on the ride and it was a good job I did. At the start 7.6 mmol/l, at 11 miles 5.4 mmol/l, at 21 miles 3.3 mmol/l, at 30 miles 6.4 mmol/l, at 38 miles 3.3 mmol/l, at 44 miles 4.6 mmol/l, at 50 miles 5.2 mmol/l, at 56 miles 4.8 mmol/l, at 62 miles 4.2 mmol/l and back home 4.6 mmol/l. I was struggling to eat stuff to just try and stop dropping into hypo territory. I had...wait for it....6 gels, malt loaf, glucogel and 1.5 energy/protein bars.
These rollercoaster levels are a bit of a pain but it doesn't put me off because we're T1, powered by insulin and can do anything if we want to. 🙂
Lake at Tatton Park

Maize just peeping through the ground in this field at Jodrell Bank

Wheat field almost fully grown also near Jodrell Bank - just needs some sun on it.

The women's Tour of Britain will be travelling up this road on Thursday near Rudyard. Not sure they'll have much time to admire the views. I'm off work that day to see it (oh and to have my retinopathy check as well)

The Garmin (same as Strava this time). The bottom number is the ride time i.e. 4hrs 25mins.


