Docb
Moderator
- Relationship to Diabetes
- Type 2
There have been a few threads asking questions about interpretation finger prick blood testing results. They go up and down, sometimes for no apparent reason, and it is not easy to get an overal picture of what is going on. Eddy Edson uses a running average which works well when big changes in something like diet are made but other than making sure you are keeping within some pre set limits you can get little from looking at the variability of routine measurements.
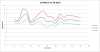
I have this idea that what looks like random data usually can tell you something if you look at it the right way and so the pile of data I have gathered presented a challenge. After poking around I did a bit of spread sheet work and derived the following graph for the period from when my carb intake and medication stabilised.

I have been taking readings before and after meals, on waking and retiring, when going to drive and at random times when I have felt rough. For the nerds, I rounded the time of day to the nearest hour, used a pivot table to get means and standard deviations, and then plotted means and +/- 1 std deviation against the rounded hour of day.
When you reaslise that I am a creature of habit and have breakfast at about 7:00; lunch at about 11:00; tea at about 16:00; a brew at about 14:00 and brew and biscuit at around 19:00 it makes sense. The ups correspond to my meal times, even spotting the brews, and the lows correspond to just before meals. At any given time nearly all the results fall within the red and green lines which means that I am always below my upper target of 10 but can get below my lower target of 5 in the afternoon. Time takes care of the higher readings and food takes care of the lower. Also makes me think that the times I am feeling rough has little to do with blood glucose - something I have suspected all along. I'm happy with that.
The message is that sometimes it might be good to not to focus on the detail but look at the bigger picture.
I have this idea that what looks like random data usually can tell you something if you look at it the right way and so the pile of data I have gathered presented a challenge. After poking around I did a bit of spread sheet work and derived the following graph for the period from when my carb intake and medication stabilised.
I have been taking readings before and after meals, on waking and retiring, when going to drive and at random times when I have felt rough. For the nerds, I rounded the time of day to the nearest hour, used a pivot table to get means and standard deviations, and then plotted means and +/- 1 std deviation against the rounded hour of day.
When you reaslise that I am a creature of habit and have breakfast at about 7:00; lunch at about 11:00; tea at about 16:00; a brew at about 14:00 and brew and biscuit at around 19:00 it makes sense. The ups correspond to my meal times, even spotting the brews, and the lows correspond to just before meals. At any given time nearly all the results fall within the red and green lines which means that I am always below my upper target of 10 but can get below my lower target of 5 in the afternoon. Time takes care of the higher readings and food takes care of the lower. Also makes me think that the times I am feeling rough has little to do with blood glucose - something I have suspected all along. I'm happy with that.
The message is that sometimes it might be good to not to focus on the detail but look at the bigger picture.