Eddy Edson
Well-Known Member
- Relationship to Diabetes
- In remission from Type 2
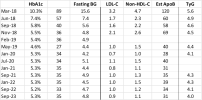
Looking back over my numbers since diagnosed in March 2018 ...

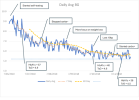
The most "interesting" period was in the ~9 months to Nov 2018:

During the Mar-early June period I didn't self test, just cut out obvious c**p & probably lost some weight from that, and took Metformin. When I started self BG-testing in June I tested a *lot*, trying to find peaks & troughs etc. Over a few weeks I used testing to adjust portion sizes for things like melon, wholemeal bread etc and continued to cut c**p.
Avg BG levels bounced around from day to day but the trend behind this noise was downwards, until in July I'd reached a point where further BG falls would be pretty meaningless, clinically, and I was not going to cut fruit, grains etc further just to get my avg BG levels below ~7 mmol/l.
BG levels and probably weight stayed fairly stable for a while. Then I became aware of Roy Taylor's work, and started to target "normal" rather than just "meh OK" - because why not? I started weighing daily, never having done this before, and explicitly cutting calories. By September I'd lost ~10kg since diagnosis, and BG levels fell to a point where I'd achieved "remission". As became clear from the later ReTUNE study, ~10kg weight loss is often enough for T2D's without overweight/obesity (like me) to achieve remission.
After that I continued to lose weight while increasing carbs from fruit, grain, melons etc but also things like noodles when I felt like it. Because my glucose regulation was sorting itself out in response to the weight loss, BG levels nevertheless continued to fall and by November I was pretty much "normal", and have been ever since, in terms of BG.
Everything seemed to be pretty much sorted, BG-wise, and I stopped testing so much & found other things to obsess about 🙂
I've shown "TyG" levels. This is a rough metric for assessing insulin resistance, based on fasting BG and fasting trigs. A level >4.5 is an indication of likely insulin resistance. I started out very insulin resistant, but with weight loss this had imrpoved to border-line by September and these days I am very insulin-sensitive, according to this metric. (While at the same time eating lots more carbs).
I have cardiovascular disease - severe PAD in the leg, moderate CAD in the heart, and from September 2018 anyway, lipids (and BP) have been much more important for my health than BG issues. The best lipid metric is apoB but unfortunately it's still not a common test - even my cardio deprecates it, for some reason.
The best apoB proxy on the standard panel is non-HDL-C and in my position you really want this to be as low as possible. It took me until mid-2019 to get it down to a level I'm comfortable with, and that has persisted also. Key factors: statin, minimal saturated fat, lots of fibre, exercise - oh, and not least, ditching the ciggies!
The table shows apoB estimated according to one of the many proposed formulas using the common lipid measures. I think these formulas are generally reasonable approximations, except when they aren't 🙂 Anyway, in my position, you want it to be in the 30's at most.
(Note that no expert guideline these days talks about lipid "ratio's" involving HDL-C compared to other metrics. They are pretty much meaningless, despite the Internet and many sadly under-trained GP's.)
The most "interesting" period was in the ~9 months to Nov 2018:
During the Mar-early June period I didn't self test, just cut out obvious c**p & probably lost some weight from that, and took Metformin. When I started self BG-testing in June I tested a *lot*, trying to find peaks & troughs etc. Over a few weeks I used testing to adjust portion sizes for things like melon, wholemeal bread etc and continued to cut c**p.
Avg BG levels bounced around from day to day but the trend behind this noise was downwards, until in July I'd reached a point where further BG falls would be pretty meaningless, clinically, and I was not going to cut fruit, grains etc further just to get my avg BG levels below ~7 mmol/l.
BG levels and probably weight stayed fairly stable for a while. Then I became aware of Roy Taylor's work, and started to target "normal" rather than just "meh OK" - because why not? I started weighing daily, never having done this before, and explicitly cutting calories. By September I'd lost ~10kg since diagnosis, and BG levels fell to a point where I'd achieved "remission". As became clear from the later ReTUNE study, ~10kg weight loss is often enough for T2D's without overweight/obesity (like me) to achieve remission.
After that I continued to lose weight while increasing carbs from fruit, grain, melons etc but also things like noodles when I felt like it. Because my glucose regulation was sorting itself out in response to the weight loss, BG levels nevertheless continued to fall and by November I was pretty much "normal", and have been ever since, in terms of BG.
Everything seemed to be pretty much sorted, BG-wise, and I stopped testing so much & found other things to obsess about 🙂
I've shown "TyG" levels. This is a rough metric for assessing insulin resistance, based on fasting BG and fasting trigs. A level >4.5 is an indication of likely insulin resistance. I started out very insulin resistant, but with weight loss this had imrpoved to border-line by September and these days I am very insulin-sensitive, according to this metric. (While at the same time eating lots more carbs).
I have cardiovascular disease - severe PAD in the leg, moderate CAD in the heart, and from September 2018 anyway, lipids (and BP) have been much more important for my health than BG issues. The best lipid metric is apoB but unfortunately it's still not a common test - even my cardio deprecates it, for some reason.
The best apoB proxy on the standard panel is non-HDL-C and in my position you really want this to be as low as possible. It took me until mid-2019 to get it down to a level I'm comfortable with, and that has persisted also. Key factors: statin, minimal saturated fat, lots of fibre, exercise - oh, and not least, ditching the ciggies!
The table shows apoB estimated according to one of the many proposed formulas using the common lipid measures. I think these formulas are generally reasonable approximations, except when they aren't 🙂 Anyway, in my position, you want it to be in the 30's at most.
(Note that no expert guideline these days talks about lipid "ratio's" involving HDL-C compared to other metrics. They are pretty much meaningless, despite the Internet and many sadly under-trained GP's.)
Attachments
Last edited:
