-
Please Remember: Members are only permitted to share their own experiences. Members are not qualified to give medical advice. Additionally, everyone manages their health differently. Please be respectful of other people's opinions about their own diabetes management.
You are using an out of date browser. It may not display this or other websites correctly.
You should upgrade or use an alternative browser.
You should upgrade or use an alternative browser.
I am bad
- Thread starter spell
- Start date
- Status
- This thread is now closed. Please contact Anna DUK, Ieva DUK or everydayupsanddowns if you would like it re-opened.
spell
Well-Known Member
It's not just the last three months, also the 3 months before that, and before that etc.all the docs are useless, more likely me who's useless,so if you got any idea how to fix this for someone who is clearly useless,then thanksAre you wanting to discuss how to improve it, or just wanting to vent?
Last edited by a moderator:
For how long do you think you have been running these kind of numbers ? You must feel pretty rough.It's not just the last three months, also the 3 months before that, and before that etc.all the docs are useless, more likely me who's useless,so if you got any idea how to fix this shite for someone who is clearly useless,then thanks
spell
Well-Known Member
Over 10 yearsFor how long do you think you have been running these kind of numbers ? You must feel pretty rough.
spell
Well-Known Member
When ever I can be bothered to go to the hospitalSorry diabetic nurse,
I don’t know what to suggest, you should go … but you know thatWhen ever I can be bothered to go to the hospital
spell
Well-Known Member
They don't make any difference anywayI don’t know what to suggest, you should go … but you know that
Lucyr
Well-Known Member
- Relationship to Diabetes
- Type 1
if you do want to get your levels down then either you need to go and see the DSN for help, or you need to read up yourself. The place to start would be with doing a basal test to check your background insulin levels. You can read how to do that on here. There is also the online Bertie course which is free and teaches this. Or you may have had training in the past that you could dig outThey don't make any difference anyway
- Relationship to Diabetes
- Type 1
- Pronouns
- He/Him
Sorry to hear you’ve had a frustrating time with appointments in the past, and haven’t found the suggestions you were offered very helpful or effective.
I think part of the challenge is that diabetes is so variable and so individual - so it’s almost impossible for Consultants and DSNs to make changes to someone’s doses that will just instantly work. It’s better to suggest strategies for the person to understand how to respond in different situations, and how to review amd respond to the data they are getting from sensors etc.
Have you ever been offered a course? Something like DAFNE?
Even if it covers ground you’ve heard or learned before, it could be a good refresher?
If you think it would be difficult to attend group sessions, youncan do these courses online and free.
eg the free BERTIE course here:
www.bertieonline.org.uk
I think that would really help you.
rebrascora
Well-Known Member
- Relationship to Diabetes
- Type 1
- Pronouns
- She/Her
The great thing about those results is that there is plenty of scope to improve them.
You just have to decide you want to do that!
We would be delighted to help you with practical advice if you are interested.
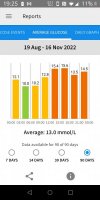
Can you post a typical daily graph so we can see what an average day looks like?
You just have to decide you want to do that!
We would be delighted to help you with practical advice if you are interested.
Can you post a typical daily graph so we can see what an average day looks like?
spell
Well-Known Member
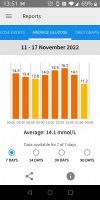
Typical weekThe great thing about those results is that there is plenty of scope to improve them.
You just have to decide you want to do that!
We would be delighted to help you with practical advice if you are interested.
Can you post a typical daily graph so we can see what an average day looks like?
Attachments
Inka
Well-Known Member
- Relationship to Diabetes
- Type 1
I’m sure you can shave a bit off those columns @spell It looks like your basal might need adjusting. Mine changes a number of times each year. Here’s a link to basal testing:
https://www.mysugr.com/en/blog/basal-rate-testing/
Basically you skip a meal to try to see what your basal does in the absence of food/boluses. You can then gradually work through the 24hrs doing a section at a time. I always do the night first because it’s easiest.
Once you’ve got your basal pretty much right, you can then move on to your mealtime ratios. You don’t have to be perfect but I’m sure that you can improve your results a bit.
rebrascora
Well-Known Member
- Relationship to Diabetes
- Type 1
- Pronouns
- She/Her
I asked if we could see a typical day's graph not a weekly average? A day's graph will show us how much fluctuation you are having. Ie are you also having hypos or are your levels all too high. Are you spiking really high after meals and then taking a long time to come back down which would suggest that a longer prebolus time would help (the time between injecting and eating) .... that sort of thing.Typical week
Certainly from those averages, it looks like basal adjustment is needed to drop your whole baseline BG but if you are having lots of hypos as well then that might make those worse so a couple typical day's graphs might be helpful to get a better idea of how variable your levels are rather than seeing the averages which will largely balance the peaks and troughs out.
- Status
- This thread is now closed. Please contact Anna DUK, Ieva DUK or everydayupsanddowns if you would like it re-opened.